

CORNWALL BUSINESS ACTIVITY, SIZE AND LOCATION 2025
Cornwall business | September 8th 2026

The Shape of Business in Cornwall
How Cornwall & Isles of Scilly’s economy has evolved over the past decade
This report provides an overview of the structure, scale and distribution of business activity across Cornwall & Isles of Scilly using the latest available data from the Office for National Statistics (ONS). Drawing on official business statistics for 2025 and comparing them with both the pre-Covid period and the position immediately following the EU referendum, the report examines how the local business base has evolved over the past decade.
The findings highlight a business community that has demonstrated considerable resilience through a period characterised by significant economic disruption, including Brexit, the Covid-19 pandemic and the subsequent cost-of-living crisis. Whilst Cornwall retains many of its traditional economic strengths, the data reveals important changes in the composition, scale and geographic distribution of business activity across the county.
1 Executive Summary
- There were 25,410 VAT and/or PAYE registered businesses in Cornwall & Isles of Scilly in 2025, 3.9% more than in 2019 and 8.2% more than in 2016.
- Cornwall & Isles of Scilly recorded the strongest annual performance of any comparable South West authority area, with business numbers declining by only 0.4% between 2024 and 2025.
- Construction has been the county’s strongest-growing major sector since both 2016 and 2019, while Agriculture, Forestry & Fishing remains one of the largest sectors despite a long-term decline in business numbers.
- Cornwall & Isles of Scilly continues to have a distinctive economic profile, with a greater concentration of agricultural, construction and tourism-related businesses than either the South West or the UK as a whole.
- Almost nine in ten businesses employ fewer than ten people, confirming the continuing importance of small businesses to the Cornish economy. However, there is little evidence that the county has become increasingly dependent on micro-businesses over time.
- The turnover profile suggests that businesses are generating higher revenues than a decade ago, although this reflects a combination of business growth, commercial maturity and inflationary effects rather than a fundamental shift in employment size. Cornwall Business Roundup 2025.
- Businesses established in Cornwall & Isles of Scilly in 2019 achieved a five-year survival rate of 46.9%, significantly above both the South West (43.5%) and UK (38.4%) averages, highlighting the resilience of the local business base.
Taken together, the findings suggest that Cornwall & Isles of Scilly has demonstrated a remarkable degree of resilience during a decade shaped by Brexit, the Covid-19 pandemic and the subsequent cost-of-living crisis. Whilst the county remains a predominantly small-business economy, the business base has continued to grow, has outperformed much of the South West since 2019, and shows evidence of increasing commercial maturity. Construction, tourism and agriculture remain defining features of Cornwall’s economy, but growth in professional services, transport and business support activities indicates an increasingly diverse and adaptable business landscape.
The challenge for the years ahead will be to build on these strengths whilst supporting the productivity, innovation and growth required to sustain long-term economic prosperity across Cornwall & Isles of Scilly.
2 Cornwall & Isles of Scilly in a UK context
The Office for National Statistics recorded 2.73 million VAT and/or PAYE registered businesses in the UK in 2025, an increase of just 0.6% compared with the pre-Covid position in 2019. However, this relatively modest national increase masks considerable variation between regions and nations. Northern Ireland recorded the strongest growth since 2019, with business numbers increasing by 7.4%, followed by the North East (+3.4%) and London (+3.1%). In contrast, the South East (-2.4%), Scotland (-2.2%) and Wales (-1.1%) all remained below their pre-Covid business totals. [Table 1]
Looking over the longer period since 2016, the UK business population has grown by 7.1%. Again, growth has been unevenly distributed. Northern Ireland (+15.9%) and London (+12.9%) have seen the largest increases in registered businesses, while Scotland (+0.7%) and the South West (+3.9%) have experienced much more modest growth. The South West has therefore been one of the slower-growing areas of the UK over the past decade, despite maintaining one of the largest business populations outside London and the South East. [Figure 1]
Within the South West, Cornwall & Isles of Scilly has performed comparatively well. The number of VAT and/or PAYE registered businesses increased from 23,475 in 2016 to 25,410 in 2025, representing growth of 8.2%, the third highest among South West local authorities. Since 2019, the business population has increased by 3.9%, second only to Plymouth (+7.3%). Although the number of businesses fell slightly between 2024 and 2025, Cornwall & Isles of Scilly recorded the smallest decline of any comparable South West authority area and therefore ranked first for year-on-year performance. [Figure 2]
By 2025, Cornwall & Isles of Scilly accounted for approximately 10.8% of all VAT and/or PAYE registered businesses in the South West, underlining its continuing importance within the regional economy. [Table 2]
Figure 1 – Number of VAT/PAYE businesses and Growth, by UK region 2016-2025
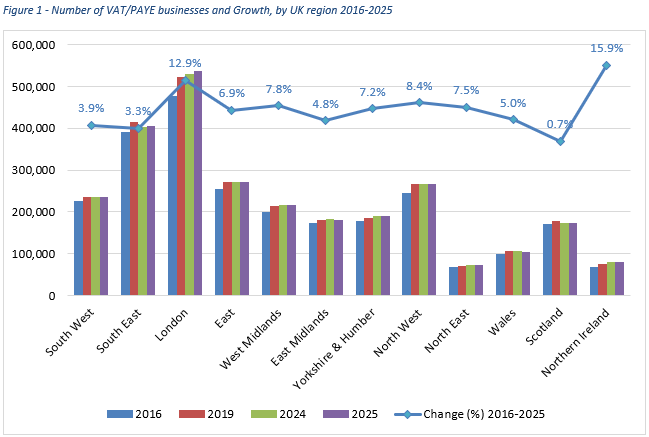
Table 1 – Number of VAT/PAYE businesses, by UK region 2016-2025
| Region | 2016 | 2019 | 2024 | 2025 | Change 2016-2025 | Change 2019-2025 | Change 2024-2025 |
|---|---|---|---|---|---|---|---|
| South West | 226,575 | 234,425 | 236,160 | 235,320 | 3.9% (10) | 0.4% (10) | -0.4% (11) |
| South East | 392,085 | 414,975 | 404,355 | 404,910 | 3.3% (11) | -2.4% (12) | 0.1% (7) |
| London | 476,890 | 522,240 | 530,815 | 538,315 | 12.9% (2) | 3.1% (3) | 1.4% (2) |
| East | 253,955 | 271,710 | 270,375 | 271,475 | 6.9% (7) | -0.1% (7) | 0.4% (5) |
| West Midlands | 200,550 | 213,915 | 216,135 | 216,145 | 7.8% (4) | 1.0% (5) | 0.0% (8) |
| East Midlands | 172,700 | 180,450 | 182,035 | 181,025 | 4.8% (9) | 0.3% (11) | -0.6% (12) |
| Yorkshire & Humber | 177,930 | 185,790 | 190,180 | 190,755 | 7.2% (6) | 2.7% (4) | 0.3% (6) |
| North West | 245,170 | 266,810 | 266,135 | 265,795 | 8.4% (3) | -0.4% (8) | -0.1% (9) |
| North East | 67,800 | 70,465 | 72,160 | 72,875 | 7.5% (5) | 3.4% (2) | 1.0% (3) |
| Wales | 99,860 | 106,015 | 105,235 | 104,820 | 5.0% (8) | -1.1% (6) | -0.4% (10) |
| Scotland | 171,900 | 177,075 | 172,255 | 173,100 | 0.7% (12) | -2.2% (9) | 0.5% (4) |
| Northern Ireland | 69,095 | 74,565 | 78,930 | 80,080 | 15.9% (1) | 7.4% (1) | 1.5% (1) |
| UK Total | 2,554,510 | 2,718,435 | 2,724,770 | 2,734,615 | 7.1% | 0.6% | 0.4% |
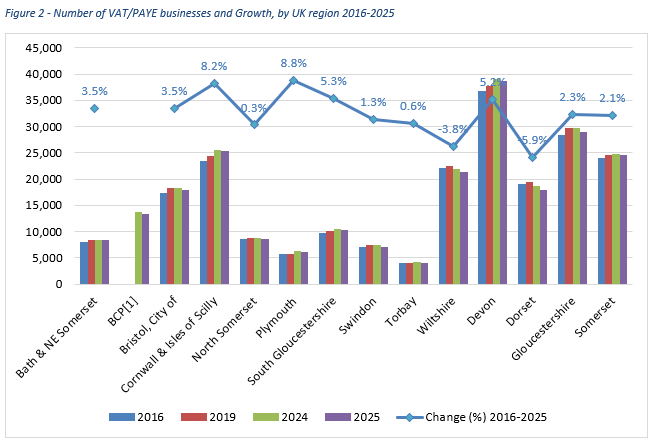
Table 2 – Number of VAT/PAYE businesses, by Authority (South West) 2016-2025
| Authority | 2016 | 2019 | 2024 | 2025 | Change 2016-2025 | Change 2019-2025 | Change 2024-2025 |
|---|---|---|---|---|---|---|---|
| Bath & NE Somerset | 8,065 | 8,440 | 8,480 | 8,345 | 3.5% (7) | -1.1% (10) | -1.6% (7=) |
| BCP[1] | 13,625 | 13,410 | -1.6% (7=) | ||||
| Bristol, City of | 17,390 | 18,335 | 18,235 | 18,005 | 3.5% (6) | -1.8% (11) | -1.3% (4=) |
| Cornwall & Isles of Scilly | 23,475 | 24,450 | 25,505 | 25,410 | 8.2% (3) | 3.9% (3) | -0.4% (1) |
| North Somerset | 8,595 | 8,755 | 8,815 | 8,620 | 0.3% (11) | -1.5% (9) | -2.2% (9) |
| Plymouth | 5,690 | 5,770 | 6,255 | 6,190 | 8.8% (2) | 7.3% (1) | -1.0% (2) |
| South Gloucestershire | 9,770 | 10,155 | 10,445 | 10,285 | 5.3% (4) | 1.3% (5) | -1.5% (6) |
| Swindon | 6,985 | 7,520 | 7,410 | 7,075 | 1.3% (9) | -5.9% (12) | -4.5% (14) |
| Torbay | 4,010 | 4,075 | 4,150 | 4,035 | 0.6% (10) | -1.0% (8) | -2.8% (11=) |
| Wiltshire | 22,195 | 22,405 | 21,965 | 21,360 | -3.8% (13) | -4.7% (13) | -2.8% (11=) |
| Devon | 36,690 | 37,725 | 39,080 | 38,585 | 5.2% (5) | 2.3% (4) | -1.3% (4=) |
| Dorset | 19,060 | 19,480 | 18,615 | 17,945 | -5.9% (14) | -7.9% (14) | -3.6% (13) |
| Gloucestershire | 28,295 | 29,630 | 29,645 | 28,935 | 2.3% (8) | -2.3% (7) | -2.4% (10) |
| Somerset | 24,010 | 24,510 | 24,830 | 24,520 | 2.1% (12) | 0.0% (6) | -1.2% (3) |
Although the number of VAT/PAYE registered businesses in Cornwall & Isles of Scilly fell marginally (0.4%) between 2024 and 2025, this represented the strongest performance of any comparable South West authority area during the year.
3 Business Type – Legal Status
The long-term shift towards incorporated businesses has continued across the UK. ONS data for 2025 shows that companies and public corporations now account for 76.7% of all VAT and/or PAYE registered businesses, while the proportion of sole proprietors and partnerships has continued to decline. Between 2024 and 2025 alone, the number of companies increased by 1.8%, while sole proprietors fell by 4.1% and partnerships by 3.9%.
The picture in Cornwall & Isles of Scilly remains somewhat different from the national average. Of the 25,550 registered enterprises recorded in 2025, approximately 55.9% were companies, compared with 24.4% sole proprietors and 15.5% partnerships. Non-profit bodies and mutual associations accounted for a further 3.2% of businesses.
Whilst incorporation continues to be the dominant business structure locally, Cornwall & Isles of Scilly retains a significantly larger proportion of sole proprietors and partnerships than is typical nationally. This reflects the area’s longstanding concentration of small and owner-managed businesses operating across sectors such as agriculture, construction, tourism and personal services. The data also reinforces the wider findings elsewhere in this report that Cornwall’s economy remains characterised by a high proportion of micro and small enterprises.
In total, the 2025 business population of Cornwall & Isles of Scilly comprised approximately 14,330 companies, 6,230 sole proprietors, 3,970 partnerships and 810 non-profit organisations, together with a small number of public sector bodies.
Despite the continuing national trend towards incorporation, Cornwall & Isles of Scilly remains considerably more reliant on sole proprietors and partnerships than the UK as a whole, highlighting the enduring importance of locally owned and owner-managed businesses within the regional economy.
4 Industry sectors
The business structure of Cornwall & Isles of Scilly continues to differ markedly from that of both the South West and the UK as a whole. While Professional, Scientific & Technical activities account for 15.3% of all registered businesses nationally, the local economy remains more heavily concentrated in traditional industries, particularly agriculture, construction and visitor economy activities. Cornwall & Isles of Scilly has a notably higher proportion of businesses operating in Agriculture, Forestry & Fishing (15.1%), Construction (15.8%) and Accommodation & Food Services (10.0%) than either the South West or UK averages. By contrast, sectors such as Information & Communication (3.3%) and Professional, Scientific & Technical activities (10.3%) account for a smaller share of the business base than they do nationally. [Figure 3 & Table 3]
The long-term trends since the Brexit referendum in 2016 reveal significant changes beneath this broadly familiar sector profile. Construction has been the standout growth sector, increasing by 32.5% between 2016 and 2025 and by 16.3% since the pre-Covid period in 2019, making it the strongest-performing major industry sector. Transport & Storage has also seen substantial expansion, with business numbers rising by 29.5% since 2016 and 26.5% since 2019. Property-related businesses have grown strongly over both periods, reflecting continuing investment and activity within Cornwall’s property market. Business Administration & Support Services has similarly expanded, growing by 17.0% since 2016 and 9.2% since 2019. These figures suggest that, whilst Cornwall retains many of its traditional economic characteristics, a number of business service sectors have continued to strengthen over the past decade. [Table 4]
Not all sectors have shared in this growth. Agriculture, Forestry & Fishing, despite remaining one of Cornwall’s largest sectors, has experienced the most significant decline, with the number of registered businesses falling by 9.9% since 2016 and 10.2% since 2019. Wholesale businesses have also contracted over both periods, while Retail and Health have seen modest declines compared with their 2016 levels. The decline in agricultural business numbers is particularly noteworthy given the sector’s continuing importance to Cornwall’s economy and landscape, suggesting ongoing consolidation and structural change within the industry.
The most recent year presents a more mixed picture. Overall business numbers in Cornwall & Isles of Scilly increased by 0.3% between 2024 and 2025, but performance varied considerably by sector. Mining, Quarrying & Utilities recorded the strongest annual growth (+4.2%), followed by Arts, Entertainment, Recreation & Other Services (+2.7%), Motor Trades (+2.5%) and Property (+2.2%). Construction also continued to expand, while Accommodation & Food Services, Wholesale and Manufacturing all recorded modest declines. Agriculture contracted slightly during the year, continuing its longer-term downward trend.
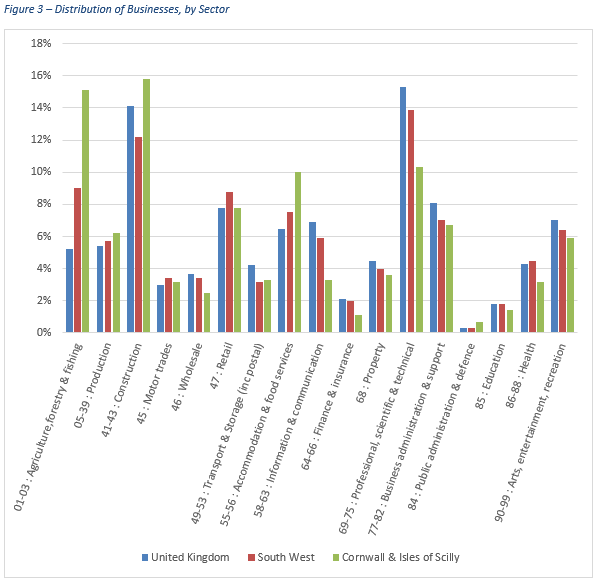
Table 3 – Distribution of Businesses, by Sector
| Industry Sector | United Kingdom | South West | Cornwall & Isles of Scilly |
|---|---|---|---|
| Agriculture, Forestry & Fishing | 5.2% | 9.0% | 15.1% |
| Production (Mining, Utilities & Manufacturing) | 5.4% | 5.7% | 6.2% |
| Construction | 14.1% | 12.2% | 15.8% |
| Motor Trades | 3.0% | 3.4% | 3.2% |
| Wholesale | 3.7% | 3.4% | 2.5% |
| Retail | 7.8% | 8.8% | 7.8% |
| Transport & Storage | 4.2% | 3.2% | 3.3% |
| Accommodation & Food Services | 6.5% | 7.5% | 10.0% |
| Information & Communication | 6.9% | 5.9% | 3.3% |
| Financial & Insurance | 2.1% | 2.0% | 1.1% |
| Property | 4.5% | 4.0% | 3.6% |
| Professional, Scientific & Technical | 15.3% | 13.9% | 10.3% |
| Business Administration & Support Services | 8.1% | 7.0% | 6.7% |
| Public Administration & Defence | 0.3% | 0.3% | 0.7% |
| Education | 1.8% | 1.8% | 1.4% |
| Health | 4.3% | 4.5% | 3.2% |
| Arts, Entertainment, Recreation & Other Services | 7.0% | 6.4% | 5.9% |
Table 4 – Number of Enterprises in Cornwall & Isles of Scilly, by Sector 2016-2025
| Industry Sector | 2016 | 2019 | 2024 | 2025 | Change 2016-2025 | Change 2019-2025 | Change 2024-2025 |
|---|---|---|---|---|---|---|---|
| Agriculture, Forestry & Fishing | 4,280 | 4,295 | 3,885 | 3,855 | -9.9% (17) | -10.2% (17) | -0.8% (13) |
| Mining, Quarrying & Utilities | 200 | 230 | 240 | 250 | 25.0% (2) | 8.7% (7) | 4.2% (1) |
| Manufacturing | 1,205 | 1,280 | 1,370 | 1,340 | 11.2% (6) | 4.7% (10) | -2.2% (16) |
| Construction | 3,045 | 3,470 | 3,985 | 4,035 | 32.5% (1) | 16.3% (1) | 1.3% (5) |
| Motor Trades | 710 | 750 | 795 | 815 | 14.8% (5) | 8.7% (6) | 2.5% (2) |
| Wholesale | 700 | 680 | 655 | 645 | -7.9% (15) | -5.1% (15) | -1.5% (14=) |
| Retail | 2,075 | 2,015 | 1,985 | 1,995 | -3.9% (13) | -1.0% (13) | 0.5% (8) |
| Transport & Storage | 645 | 660 | 835 | 835 | 29.5% (3) | 26.5% (2) | 0.0% (10=) |
| Accommodation & Food Services | 2,330 | 2,415 | 2,590 | 2,550 | 9.4% (8) | 5.6% (8) | -1.5% (14=) |
| Information & Communication | 745 | 835 | 835 | 830 | 11.4% (4) | -0.6% (12) | -0.6% (12) |
| Financial & Insurance | 255 | 280 | 290 | 290 | 13.7% (5) | 3.6% (11) | 0.0% (10=) |
| Property | 705 | 785 | 900 | 920 | 30.5% (2) | 17.2% (3) | 2.2% (3) |
| Professional, Scientific & Technical | 2,370 | 2,485 | 2,595 | 2,620 | 10.5% (7) | 5.4% (9) | 1.0% (6) |
| Business Administration & Support Services | 1,470 | 1,575 | 1,695 | 1,720 | 17.0% (4) | 9.2% (5) | 1.5% (4) |
| Public Administration & Defence | 150 | 160 | 165 | 170 | 13.3% (4) | 6.3% (8) | 3.0% (2) |
| Education | 330 | 315 | 365 | 365 | 10.6% (6) | 15.9% (4) | 0.0% (10=) |
| Health | 860 | 800 | 820 | 815 | -5.2% (14) | 1.9% (11) | -0.6% (11) |
| Arts, Entertainment, Recreation & Other Services | 1,395 | 1,405 | 1,465 | 1,505 | 7.9% (9) | 7.1% (7) | 2.7% (1) |
5 Business Size
The majority of businesses in Cornwall & Isles of Scilly continue to operate on a relatively small scale. As with the UK and the South West as a whole, most business sites employ fewer than ten people and most enterprises generate annual turnover of less than £250,000. However, examining both employment size and turnover provides a more complete picture of how the business base has evolved over the past decade. Employment size offers the clearest indication of organisational scale, whereas turnover reflects financial scale and can also be influenced by factors such as inflation, pricing and rising business costs. Consequently, the employment data provides the most reliable indicator of structural change within the business population, while the turnover data offers additional insight into commercial performance and business maturity.
5.1 By Employment
The employment profile of Cornwall & Isles of Scilly remains broadly similar to that of both the South West and the UK as a whole. In 2025, 76.1% of registered businesses employed fewer than five people, compared with 77.5% across the South West and 78.2% nationally. A further 12.6% employed between five and nine people. Taken together, almost nine in ten businesses (88.7%) employed fewer than ten people, underlining the continuing importance of small businesses within the local economy. [Figure 4 & Table 5]
Compared with the national picture, Cornwall & Isles of Scilly has a slightly lower proportion of the very smallest businesses and a correspondingly higher proportion of businesses employing between five and 49 people. This suggests a business base that is not unusually dependent on sole operators or lifestyle businesses, but instead contains a relatively strong cohort of established small employers.
The distribution of employment sizes has changed relatively little since either 2016 or 2019. While the number of businesses employing fewer than five people has increased by 11.8% over the period, growth has also occurred amongst businesses employing 20-99 people. The strongest increases have been in businesses employing 50-99 staff, which have grown by 21.1% since 2016 and 9.5% since 2019. Importantly, the data does not indicate a material shift towards an increasingly micro-business economy. Rather, growth has occurred across several employment categories, leaving the overall structure of the business population largely unchanged. [Table 6]
The most recent year saw only modest changes, with the total number of registered businesses increasing by 0.3%. Most employment categories remained broadly stable, reinforcing the view that the size structure of Cornwall’s business base has been remarkably consistent through Brexit, the Covid pandemic and the subsequent recovery period.
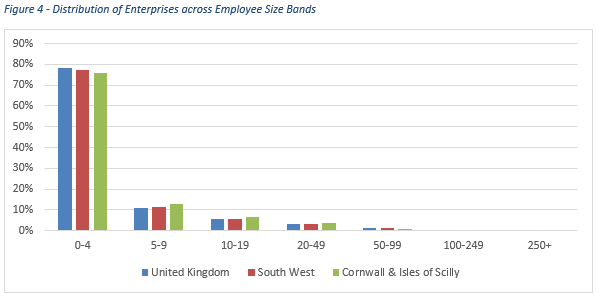
Table 5 – Distribution of Enterprises across Employee Size Bands
| Employees | United Kingdom | South West | Cornwall & IoS |
|---|---|---|---|
| 0-4 | 78.2% | 77.5% | 76.1% |
| 5-9 | 11.0% | 11.5% | 12.6% |
| 10-19 | 5.7% | 5.8% | 6.4% |
| 20-49 | 3.1% | 3.3% | 3.5% |
| 50-99 | 1.1% | 1.1% | 0.9% |
| 100-249 | 0.5% | 0.5% | 0.4% |
| 250-499 | 0.2% | 0.2% | 0.2% |
| 500-999 | 0.1% | 0.1% | 0.0% |
| 1000+ | 0.1% | 0.1% | 0.1% |
Table 6 – Distribution of Cornwall & IoS Enterprises across Employee Size Bands 2016-2025
| Employees | 2016 | 2019 | 2024 | 2025 | Change 2016-2025 | Change 2019-2025 | Change 2024-2025 |
|---|---|---|---|---|---|---|---|
| 0-4 | 17,390 | 18,300 | 19,225 | 19,440 | 11.8% | 6.2% | 1.1% |
| 5-9 | 3,330 | 3,320 | 3,345 | 3,220 | -3.3% | -3.0% | -3.7% |
| 10-19 | 1,615 | 1,640 | 1,620 | 1,620 | 0.3% | -1.2% | 0.0% |
| 20-49 | 800 | 825 | 895 | 885 | 10.6% | 7.3% | -1.1% |
| 50-99 | 190 | 210 | 225 | 230 | 21.1% | 9.5% | 2.2% |
| 100-249 | 100 | 85 | 105 | 95 | -5.0% | 11.8% | -9.5% |
| 250-499 | 35 | 45 | 35 | 40 | 14.3% | -11.1% | 14.3% |
| 500-999 | 10 | 15 | 15 | 10 | 0.0% | -33.3% | -33.3% |
| 1000+ | 10 | 10 | 10 | 15 | 50.0% | 50.0% | 50.0% |
| Total | 23,480 | 24,450 | 25,475 | 25,555 | 8.8% | 4.5% | 0.3% |
5.2 By Turnover
The turnover data paints a rather different picture. Cornwall & Isles of Scilly continues to have a slightly higher proportion of businesses in the lower turnover bands than both the South West and the UK as a whole. In 2025, 15.8% of enterprises reported annual turnover of less than £50,000, compared with 15.0% across the South West and 14.2% nationally. Conversely, only a small proportion of local businesses reported turnover in excess of £10 million. [Figure 5 & Table 7]
However, the distribution of businesses across turnover bands has shifted noticeably over time. Since 2016, the number of businesses in the two lowest turnover bands has fallen, while substantial growth has occurred in businesses reporting turnover above £500,000 per annum. Particularly strong growth has been recorded in the £500,000-£999,999, £1 million-£1.99 million and £2 million-£4.99 million bands, while the number of enterprises reporting turnover above £10 million has also increased. [Table 8]
These changes should be interpreted with some caution. Unlike employment size, turnover bands are based on nominal monetary values and are therefore influenced by inflation and rising business costs. A business can move into a higher turnover band without necessarily increasing production, employment or productivity if higher prices simply offset increased wage, energy, transport or input costs. Given the significant inflation experienced between 2021 and 2023, some upward movement through the turnover bands would be expected even without substantial changes in underlying business activity.
The comparison between the two sets of tables is therefore particularly revealing. While the employment distribution has changed relatively little over the past decade, the turnover distribution has shifted more noticeably towards higher-value bands. This suggests that Cornwall’s businesses are generating higher revenues than in 2016 or 2019, but that these increased revenues have not been accompanied by equivalent increases in workforce size. Some of this shift is likely to reflect inflationary effects, although it may also indicate increasing business maturity, greater commercial activity, improved productivity, or businesses achieving higher turnover without significant increases in employment.
Consequently, the turnover data should be interpreted as evidence of a shift in the financial scale of Cornwall’s businesses rather than conclusive evidence that businesses have become substantially larger employers. Taken together, the employment and turnover data suggest a business base that remains predominantly small in terms of workforce size, but which is increasingly generating revenues associated with larger and more commercially mature enterprises.
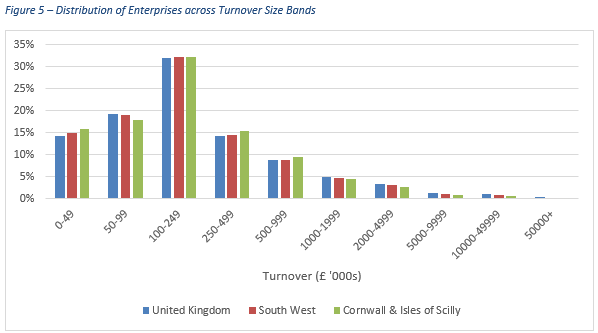
Table 7 – Distribution of Enterprises across Turnover Size Bands
| Turnover (£000s) | United Kingdom | South West | Cornwall & Isles of Scilly |
|---|---|---|---|
| 0-49 | 14.2% | 15.0% | 15.8% |
| 50-99 | 19.2% | 19.1% | 18.0% |
| 100-249 | 31.9% | 32.2% | 32.2% |
| 250-499 | 14.3% | 14.6% | 15.5% |
| 500-999 | 8.9% | 8.9% | 9.6% |
| 1,000-1,999 | 5.0% | 4.8% | 4.6% |
| 2,000-4,999 | 3.5% | 3.2% | 2.7% |
| 5,000-9,999 | 1.3% | 1.1% | 0.8% |
| 10,000-49,999 | 1.2% | 0.9% | 0.7% |
| 50,000+ | 0.4% | 0.3% | 0.1% |
Table 8 – Distribution of Cornwall & IoS Enterprises across Turnover Size Bands 2016-2025
| Turnover (£000s) | 2016 | 2019 | 2024 | 2025 | Change 2016-2025 | Change 2019-2025 | Change 2024-2025 |
|---|---|---|---|---|---|---|---|
| 0-49 | 4,585 | 4,480 | 4,095 | 4,025 | -12.2% | -10.2% | -1.7% |
| 50-99 | 4,890 | 4,870 | 4,715 | 4,600 | -5.9% | -5.5% | -2.4% |
| 100-249 | 7,380 | 7,970 | 8,130 | 8,235 | 11.6% | 3.3% | 1.3% |
| 250-499 | 3,360 | 3,560 | 3,945 | 3,980 | 18.5% | 11.8% | 0.9% |
| 500-999 | 1,660 | 1,865 | 2,340 | 2,450 | 47.6% | 31.4% | 4.7% |
| 1,000-1,999 | 880 | 890 | 1,160 | 1,170 | 33.0% | 31.5% | 0.9% |
| 2,000-4,999 | 465 | 535 | 685 | 685 | 47.3% | 28.0% | 0.0% |
| 5,000-9,999 | 140 | 145 | 205 | 200 | 42.9% | 37.9% | -2.4% |
| 10,000-49,999 | 95 | 110 | 165 | 170 | 78.9% | 54.5% | 3.0% |
| 50,000+ | 15 | 25 | 30 | 35 | 133.3% | 40.0% | 16.7% |
| Total | 23,475 | 24,450 | 25,475 | 25,550 | 8.8% | 4.5% | 0.3% |
6 Business Activity by Parliamentary Constituency
Business activity is not distributed evenly across Cornwall. Whilst agriculture, construction and tourism-related businesses are important throughout the county, individual parliamentary constituencies exhibit distinct business profiles reflecting their geography, settlement patterns and economic specialisms. Examining business activity at constituency level provides a more detailed understanding of Cornwall’s economic diversity and highlights the different contributions made by rural, coastal and urban areas to the wider Cornish economy.
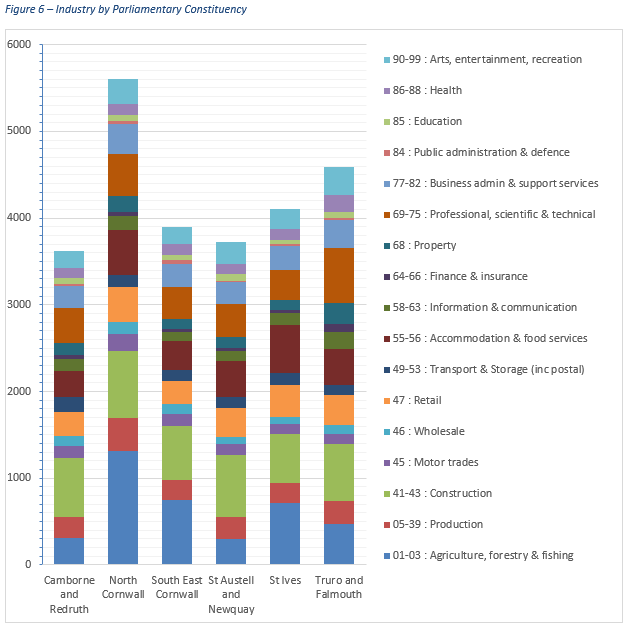
North Cornwall remains the largest business constituency in Cornwall, with a particularly strong concentration of agricultural enterprises. More than 1,300 businesses operate in agriculture, forestry and fishing, far exceeding any other constituency and reflecting the area’s predominantly rural character. Agriculture is the largest sector in North Cornwall and accounts for almost a quarter of all businesses in the constituency. Construction is also prominent, with 775 businesses, while accommodation and food services accounts for a further 520 enterprises. [Figure 6]
Truro & Falmouth presents a markedly different business profile. Whilst construction remains one of the largest sectors, the constituency has the strongest representation of professional, scientific and technical businesses, with 630 enterprises operating in the sector. It also contains the largest concentrations of finance and insurance, property, information and communication, and health-related businesses, reflecting its role as Cornwall’s principal administrative, educational and professional services centre.
Tourism-related businesses are particularly important in the western and coastal constituencies. St Ives has the largest accommodation and food services sector in Cornwall, with 555 businesses, while North Cornwall and Truro & Falmouth also have substantial visitor economy sectors. Together these figures underline the continuing importance of tourism and hospitality to many parts of the Cornish economy.
Construction is one of the most significant sectors across all six constituencies and is the largest individual sector in Camborne & Redruth, St Austell & Newquay and Truro & Falmouth. This reinforces a pattern already identified elsewhere in the report, with construction having become one of Cornwall’s most important business sectors both in terms of size and long-term growth.
7 Business Demography
Business counts provide a snapshot of the number of active enterprises at a point in time, but they do not reveal the degree of business churn occurring beneath the surface. Business demography statistics measure the creation, closure and survival of businesses, providing valuable insight into entrepreneurial activity and the resilience of the local business base.
In 2024, 2,130 new businesses were created in Cornwall & Isles of Scilly, whilst 1,930 businesses ceased trading. This produced a net increase of approximately 200 enterprises. Although the local business birth rate (9.1%) was lower than both the South West (9.6%) and UK (11.1%) averages, the business death rate was also lower at 8.2%, compared with 9.1% across the South West and 9.8% nationally. [Table 9]
The survival statistics suggest that Cornwall’s business resilience is built not only on new business creation but also on the ability of businesses to remain active over time. Of the 2,205 businesses established in Cornwall & Isles of Scilly during 2019, approximately 1,035 were still trading five years later, giving a five-year survival rate of 46.9%. This was substantially higher than both the South West average (43.5%) and the UK average (38.4%). [Table 10]
Taken together, these findings suggest that Cornwall & Isles of Scilly experiences lower levels of business churn than many other parts of the country. Whilst new business creation occurs at a slightly lower rate than nationally, businesses that do establish themselves appear more likely to survive. This helps explain the resilience of the area’s business population through a decade characterised by Brexit, the Covid-19 pandemic and the subsequent cost-of-living crisis.
Table 9 – Business Births and Deaths, 2024
| Area | Active Enterprises | Business Births | Business Deaths | Birth Rate | Death Rate |
|---|---|---|---|---|---|
| UK | 2,859,535 | 317,440 | 280,370 | 11.1% | 9.8% |
| South West | 232,765 | 22,330 | 21,250 | 9.6% | 9.1% |
| Cornwall & Isles of Scilly | 23,425 | 2,130 | 1,930 | 9.1% | 8.2% |
Table 10 – Five-Year Business Survival (2019 Cohort)
| Area | Businesses Born in 2019 | Surviving to 2024 | Five-Year Survival Rate |
|---|---|---|---|
| UK | 363,825 | 139,845 | 38.4% |
| South West | 23,940 | 10,425 | 43.5% |
| Cornwall & Isles of Scilly | 2,205 | 1,035 | 46.9% |
[1] Bournemouth, Christchurch & Poole (BCP) was created in April 2019 replacing Bournemouth, Poole and Christchurch authorities. Growth rates are therefore not directly comparable with earlier years and have been omitted.
More from Cornwall business
CORNWALL BUSINESS ACTIVITY, SIZE AND LOCATION 2020

The 2019 overview of Cornwall business activity, size and location with some comparisons to South West and UK data.
CORNWALL BUSINESS ACTIVITY, SIZE AND LOCATION 2019
The 2019 overview of Cornwall business activity, size and location with some comparisons to South West and UK data.
THE DIGITAL, ALWAYS-ON LEARNING OPPORTUNITY
In an effort to increase the average weekly earnings in Cornwall, is Cornwall Council's best approach to invest in online learning?