CORNWALL BUSINESS ACTIVITY, SIZE AND LOCATION 2020
Cornwall business | May 21st 2020

1 Cornwall & Isles of Scilly in a UK context
The Office for National Statistics (ONS) publishes data on UK Business activity, size and location annually. As of March 2019 there were 2,718,435 businesses registered in the UK for VAT and/or PAYE (Pay As You Earn), a rise of 1.84% from the 2,669,440 businesses registered in March 2018, and a larger increase than the 0.02% rise from 2017-2018.
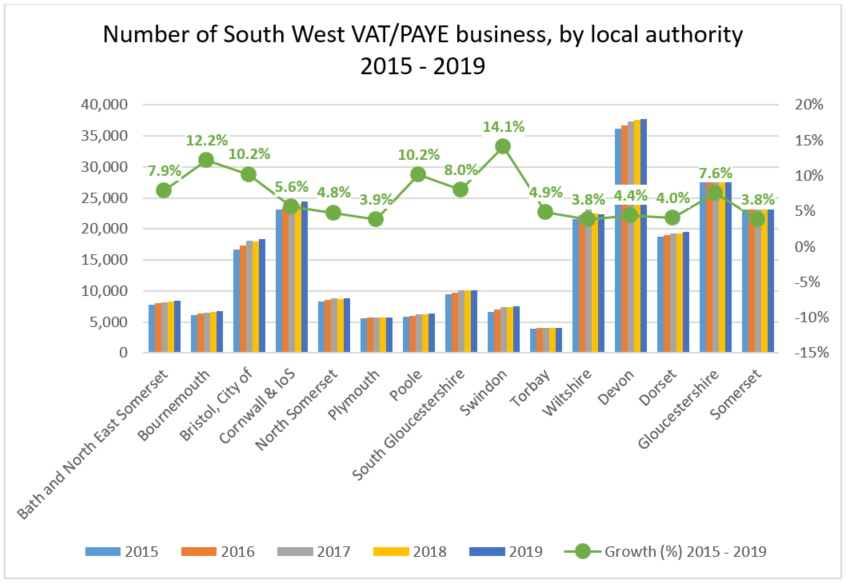
Following steady increases in the number of VAT and/or PAYE businesses between 2015 and 2018 across all regions, the South West saw the total number of businesses increasing by 2,680 in the year 2018-19. Since 2015 the South West has grown just 6.2% in terms of number of businesses, the second least of all the English regions. By comparison, London which has the largest number of VAT and/or PAYE-based businesses of all UK regions, has grown the most, by 17.4%, followed by the North West on 13.1%.
Greatest rates of growth in the year 2018-2019 are currently being seen in London (3.17%), the East (2.96%), and the South East (2.57%), which is completely different from the 2017-2018 year where the greatest rates of growth were seen in Northern Ireland, the North West, and Wales.


The number of Cornwall & Isles of Scilly VAT/PAYE businesses has risen by 5.65% since 2015, now ranked eighth of the South West counties and unitary authorities compared to tenth in 2015-18. A growth of 450 (1.88%) for the most recent year 2018-19 puts it fourth in the South West region, only behind Bournemouth (3.04%), Poole (2.49%), and Bath and North East Somerset (2.43%), going up from fifth in 2017-18.

2 Business type – Legal Status
UK wide, the number of companies and public corporations continues to rise and now represents 72.5% of total businesses (increased from 71.4% for 2017-18). The number of sole proprietors and partnerships continues to decline and now represents 16.3% of total businesses, down from the 24.8% in 2018.
In the South West[1], companies make up a smaller proportion of businesses, at 64.1% (a slight increase from 63.1% in 2018) and sole proprietors and partnerships make up a correspondingly higher proportion, at 31.7% (decreased from 32.7% in 2018 and 33.1% for 2017). Non-profit bodies or mutual associations still make up 3.5% of businesses in the South West which remains broadly in line with the UK average at 3.2%.
3 Industry sectors
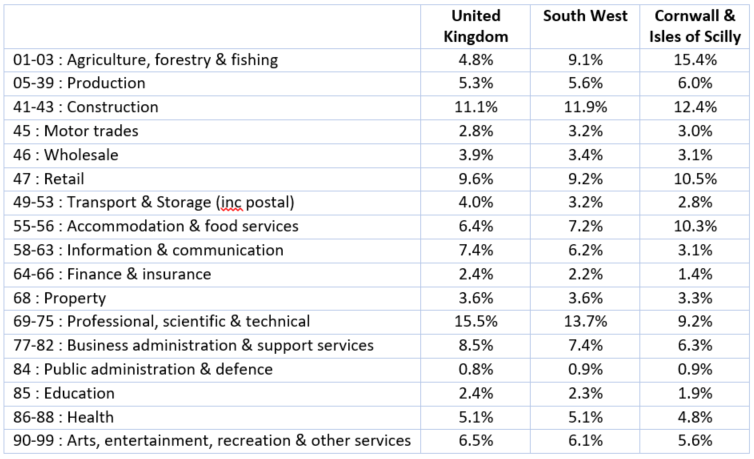
In 2019, agriculture, forestry & fishing remains the largest industry group in Cornwall and Scilly with 15.4% of all registered businesses. Construction (12.4%) is still next largest, followed by retail (10.5%), and accommodation & food services (10.3%).

4 Business Size
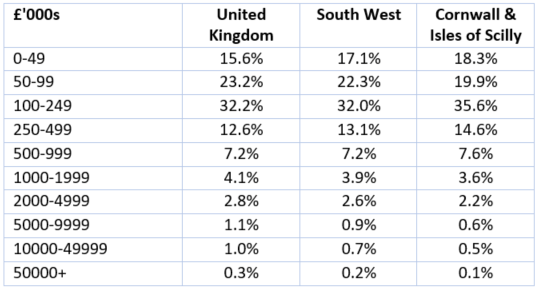
The ONS 2019 data shows that Cornwall & Isles of Scilly still has a higher proportion of businesses in the lowest turnover band (less than £50,000), with 18.3% compared to the UK average of 15.6%.
Cornwall & Isles of Scilly also has fewer of the larger businesses with a turnover of £1m and over – 7% (marginally up from 6.8%) compared to 9.3% (up from 9.1%) across the UK as a whole.

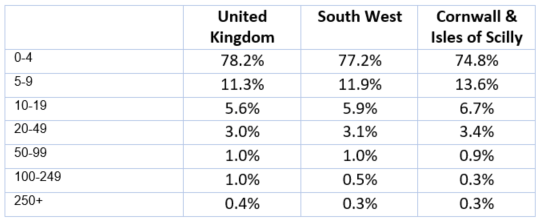
In terms of employment size, the 2019 statistics are similar to previous years; Cornwall & Scilly is still representative of the UK average, except:
- it has a lower proportion of businesses with 4 or less employees (74.8% compared to the UK average of 78.2%), and
- it has a greater proportion of businesses with 5-9 employees than the UK average (13.6% compared to 11.3%).
Also, there is still no conclusive evidence to suggest that Cornwall and Isles of Scilly has a significantly higher proportion of micro entities than the UK as a whole[2]:
- 88.4% of VAT/PAYE registered businesses in Cornwall & Scilly have a turnover less than £500,000 compared to 83.6% in the UK as a whole
- 88.4% have less than 10 employees, more than one percentage point below the UK average of 89.5%

5 Business dynamics by Parliamentary Constituency area
North Cornwall, the largest area geographically, still has the greatest number of VAT/PAYE registered businesses with 5,185 in total (up from 5,075). Truro and Falmouth come next with 4,680 businesses and it is still the area showing the largest growth with 3% more enterprises than 2018 (up from 4,545). St Austell & Newquay has 3,865 registered businesses (up from 3,765) followed by St Ives with 3,840 (slightly up from 3,830), South East Cornwall has 3,835 registered businesses (up from 3,820) and Camborne & Redruth has the fewest businesses, with 3,045 but an increase from the 2,965 in 2018.

By industry:
- Agriculture, forestry & fishing is still the largest industry overall in Cornwall with 4,295 businesses, a slight increase from 4,280 in 2018. Construction is the second largest with 3,475 businesses (up from 3,280 in 2018) and third is the Professional, scientific & technical industry with 2,485 businesses (up from 2,415 in 2018).
- North Cornwall is in the lead when it comes to agricultural businesses with 26% of its total 5,185 businesses operating in the industries of agriculture, forestry & fishing; and 31.4% of all Cornwall’s agriculture businesses are in North Cornwall. South East Cornwall comes second with 21% of businesses operating in the agricultural industry. Truro & Falmouth has the least with just 11.2%.
- St Austell & Newquay and Camborne & Redruth equally have the greatest proportion of construction sector businesses, with 17.2% of all their businesses operating in the industry.
- Truro & Falmouth has the greatest proportion of professional, scientific & technical businesses which, with 14.3%, is also the biggest industry overall for the area followed by construction (13%).
In terms of business size, about three quarters (74.8%) of businesses in Cornwall have less than 5 employees. Businesses with 5-9 employees represent the second largest group with 13.6% across Cornwall. North Cornwall has the highest proportion of businesses (20.6%) within the lowest turnover band of less than £50,000.
Camborne and Redruth, as the area with the least number of businesses, has the highest proportion of businesses employing over 10 people (13.3%). It is also the area with the highest proportion of businesses turning over £1m or more (8.2%). In terms of absolute numbers however, Truro & Falmouth has the greatest number of businesses with 10 or more employees (585), followed by North Cornwall (525). Similarly, Truro & Falmouth has the greatest absolute number of businesses turning over £1m or more (350) followed by North Cornwall (330).
[1] Figures for Cornwall & Isles of Scilly alone are not available.
[2] It is not possible to cross analyse ONS statistics at a business level. The strict definition as to what constitutes a ‘micro-entity’ is where at least two of the following criteria are met:
- Turnover – not more than £632,000 (adjusted proportionately if the financial year is longer or shorter than 12 months)
- Balance sheet total – not more than £316,000
- Average number of employees – not more than 10
More from Cornwall business
CORNWALL BUSINESS ACTIVITY, SIZE AND LOCATION 2019
The 2019 overview of Cornwall business activity, size and location with some comparisons to South West and UK data.
THE DIGITAL, ALWAYS-ON LEARNING OPPORTUNITY
In an effort to increase the average weekly earnings in Cornwall, is Cornwall Council's best approach to invest in online learning?