CORNWALL BUSINESS ACTIVITY, SIZE AND LOCATION 2019
Cornwall business | August 12th 2019

As usual we have throughout the year been publishing insights into the business marketplace in Cornwall & Scilly in collaboration with market research company, PFA Research. The latest figures were released by the Office for National Statistics in October 2018 and it seems an appropriate way to start the New Year by delving into this latest business data.
1) Cornwall & Isles of Scilly in a UK context
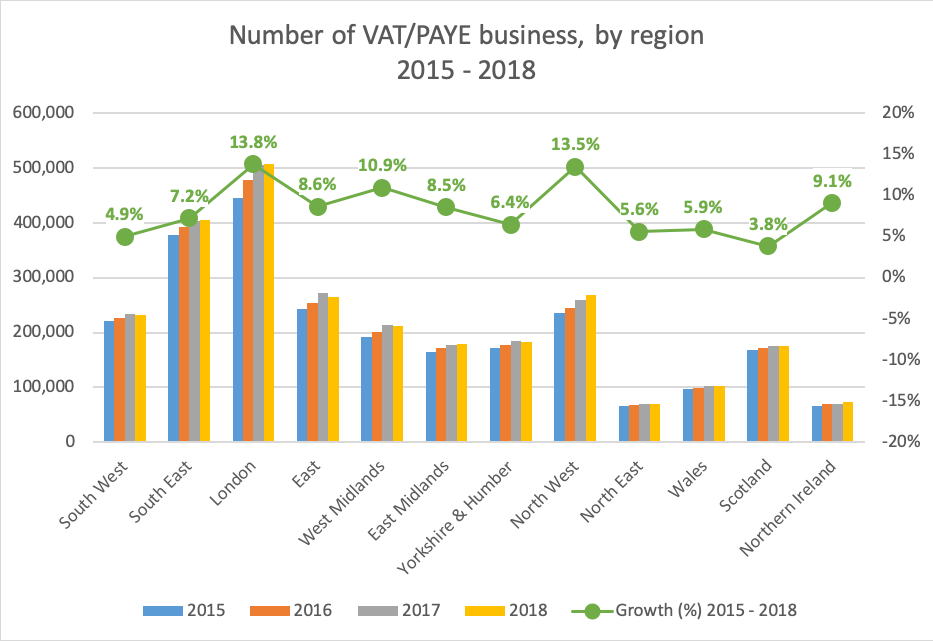
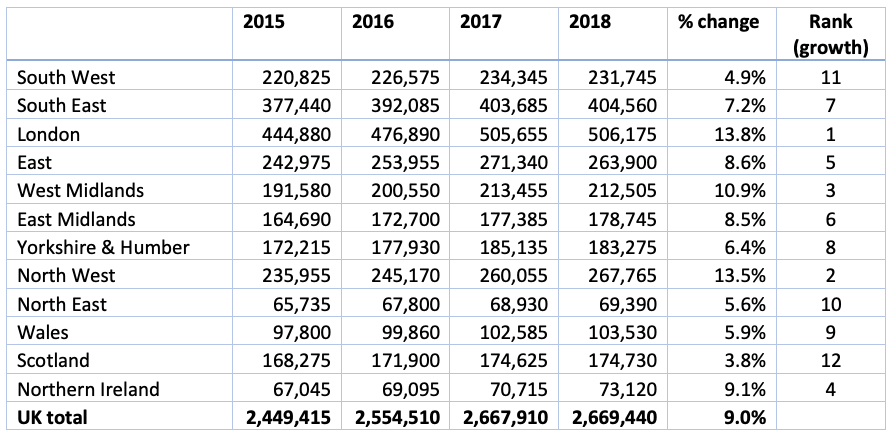
The Office for National Statistics (ONS) publishes data on UK Business activity, size and location annually. As of March 2018 there were 2,669,440 businesses registered in the UK for VAT and/or PAYE (Pay As You Earn), broadly unchanged from the 2,668,810 measured at March 2017 – a rise of just 0.02% compared to the 4.5% increase 2016-17 and the 4.3% rise for the 2015-16 year before that.
Following steady increases in the number of VAT and/or PAYE businesses between 2015 and 2017 across all regions, the South West saw the total number of businesses declining by 2,600 in the year 2017-18. Since 2015 the South West has grown just 4.9% in terms of number of businesses, the least of all the English regions. By comparison, London which has the largest number of VAT and/or PAYE-based businesses of all UK regions, has grown the most, by 13.8%, followed by the North West on 13.5%.
However, London which traditionally up until 2016-17 has shown the largest growth, was ‘only’ sixth in 2017-18 with a growth rate of 0.1%, after being fourth in 2016-17 (6.0%). Greatest rates of growth are currently being seen in Northern Ireland (3.4%), the North West (2.96%) and Wales (0.92%).
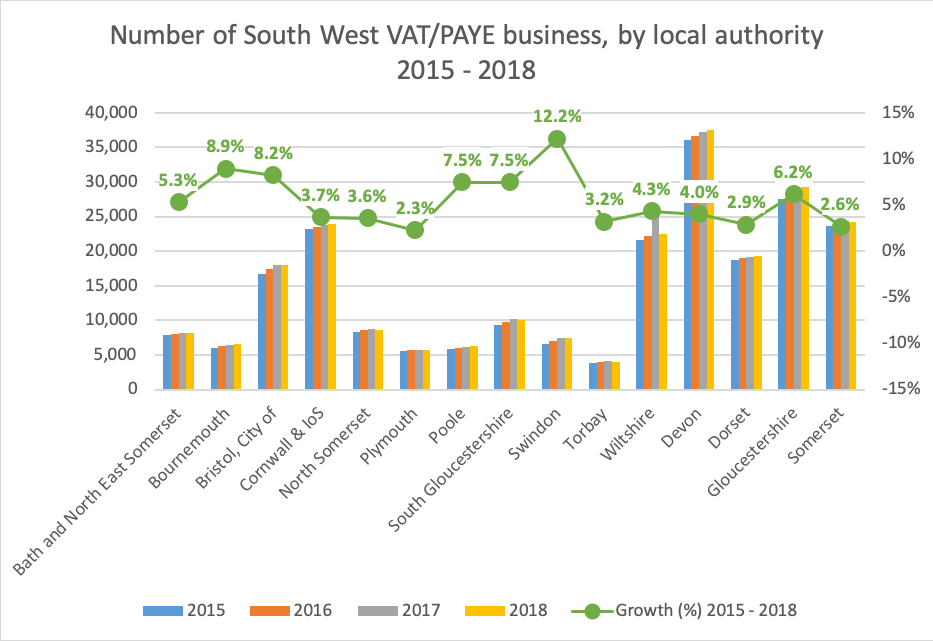
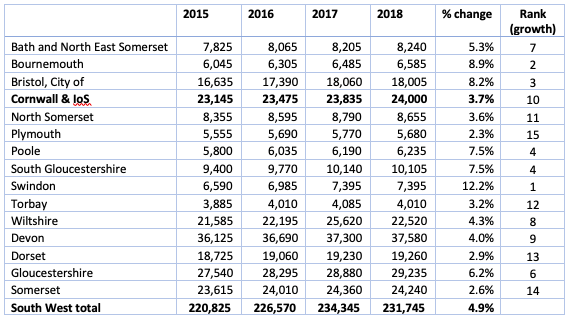
Growth appears slower in Cornwall & Isles of Scilly over the three year period compared to the South West average, where the number of VAT/PAYE businesses has risen by just 3.7% (ranked 10th of the South West counties and unitary authorities). However, growth of ‘just’ 165 for the most recent year 2017-18 is a respectable fifth in the South West region, only behind Bournemouth (1.54%), Gloucestershire (1.23%), Devon (0.75%) and Poole (0.73%).
2) Business type – Legal Status
UK wide, the number of companies and public corporations continues to rise and now represents 71.4% of total businesses (increased from 70.7% for 2016-17) . The number of sole proprietors and partnerships continues to decline and now represents 24.8% of total businesses, down 0.8 percentage points since 2017 and further to the 1.8% decline the year before that.
In the South West, companies make up a smaller proportion of businesses, at 63.1% (increased from 60.7% in 2017), and sole proprietors and partnerships make up a correspondingly higher proportion, at 32.7% (decreased from 33.1% for 2017). Non-profit bodies or mutual associations make up 3.5% of businesses in the South West which remains broadly in line with the UK average at 3.3%.
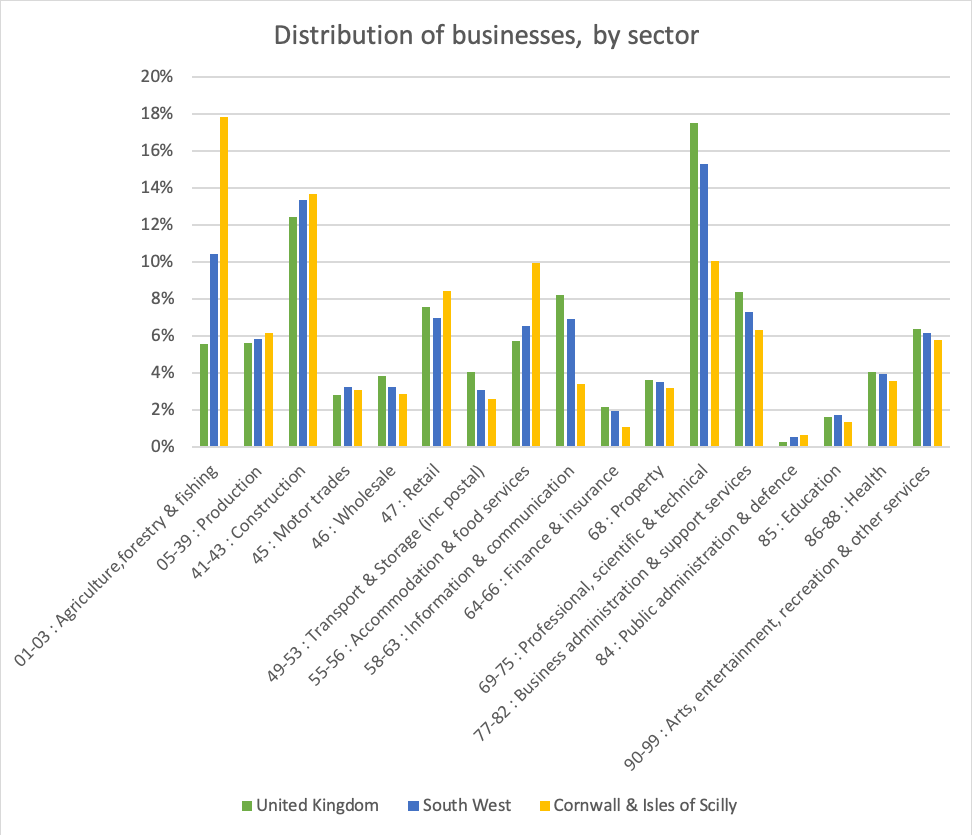
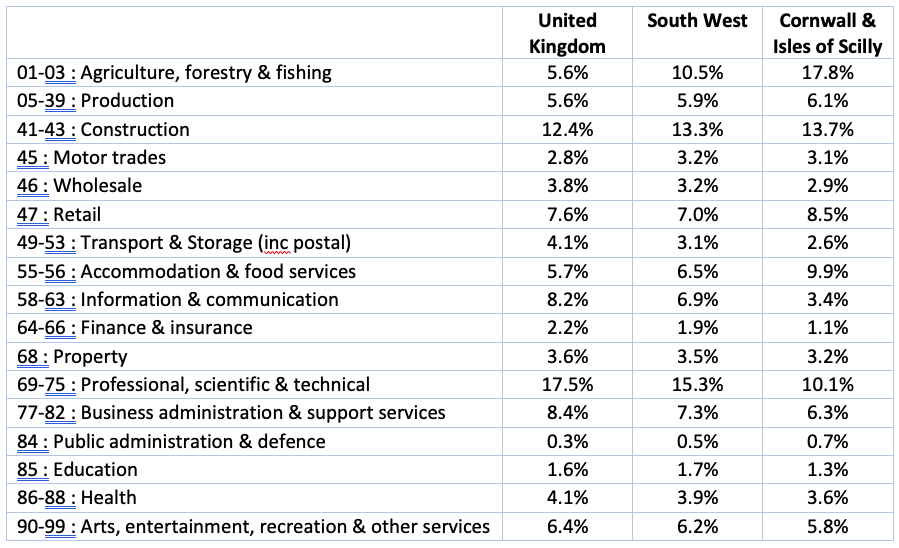
3) Industry sectors
In 2018, agriculture, forestry & fishing remains the largest industry group in Cornwall and Scilly with 17.8% of all registered businesses. Construction (13.7%) is still next largest, followed by professional, scientific and technical businesses (10.1%) and accommodation and food services (9.9%).
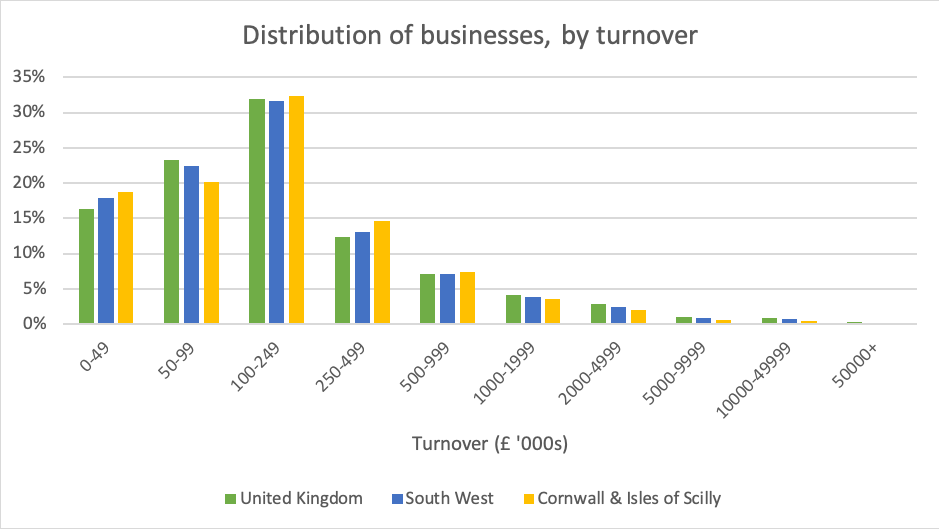
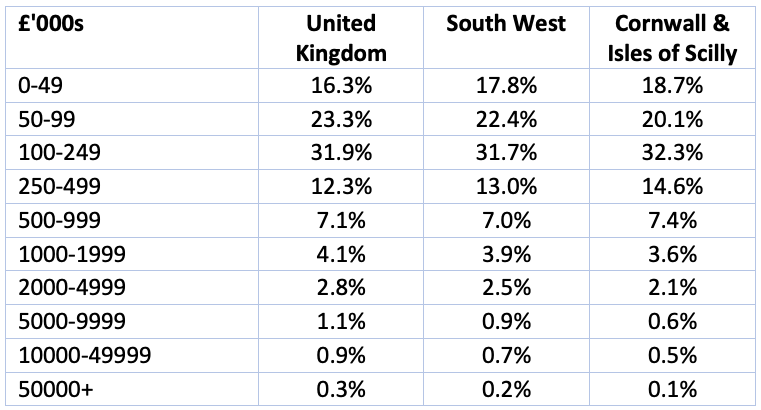
4) Business Size
The ONS 2018 data shows that Cornwall & Isles of Scilly still has a higher proportion of businesses in the lowest turnover band (less than £50,000), with 18.7% compared to the UK average of 16.3% – both of which have decreased from 20.1% and 17.2% respectively.
Cornwall & Isles of Scilly also has fewer bigger businesses with a turnover of £1m and over – 6.8% (marginally up from 6.7%) compared to 9.1% (up from 8.9%) across the UK as a whole.
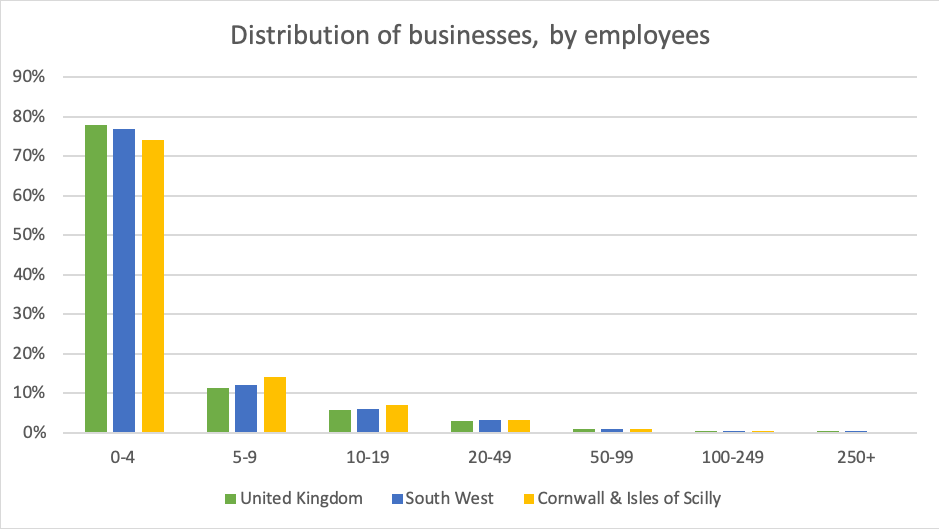
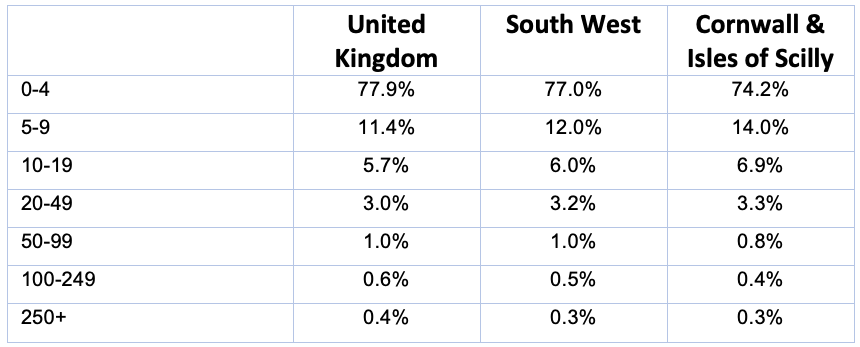
In terms of employment size, the 2018 statistics are similar to previous years; Cornwall & Scilly is still representative of the UK average, except:
- it has a lower proportion of businesses with 4 or less employees (74.2% compared to the UK average of 77.9%), and
- it has a greater proportion of businesses with 5-9 employees than the UK average (14.0% compared to 11.4%).
Also, there is still no conclusive evidence to suggest that Cornwall and Isles of Scilly has a significantly higher proportion of micro entities than the UK as a whole:
- 85.8% of VAT/PAYE registered businesses in Cornwall & Scilly have a turnover less than £500,000 compared to 83.7% in the UK as a whole
- 88.2% have less than 10 employees, more than one percentage point below the UK average of 89.3
5) Business dynamics by Parliamentary Constituency area
North Cornwall, the largest area geographically, still has the greatest number of VAT/PAYE registered businesses with 5,075 in total (up from 5,035). Truro and Falmouth come next with 4,545 businesses and this year is the area showing the largest growth with 2.1% more enterprises than 2017 (up from 4,450). South East Cornwall has 3,820 registered businesses (down from 3,850) followed by St Ives with 3,830 (slightly up from 3,820), St Austell & Newquay has 3,765 (slightly up from 3,740) and Camborne & Redruth has the fewest businesses, with 2,965 (down from 2,935).
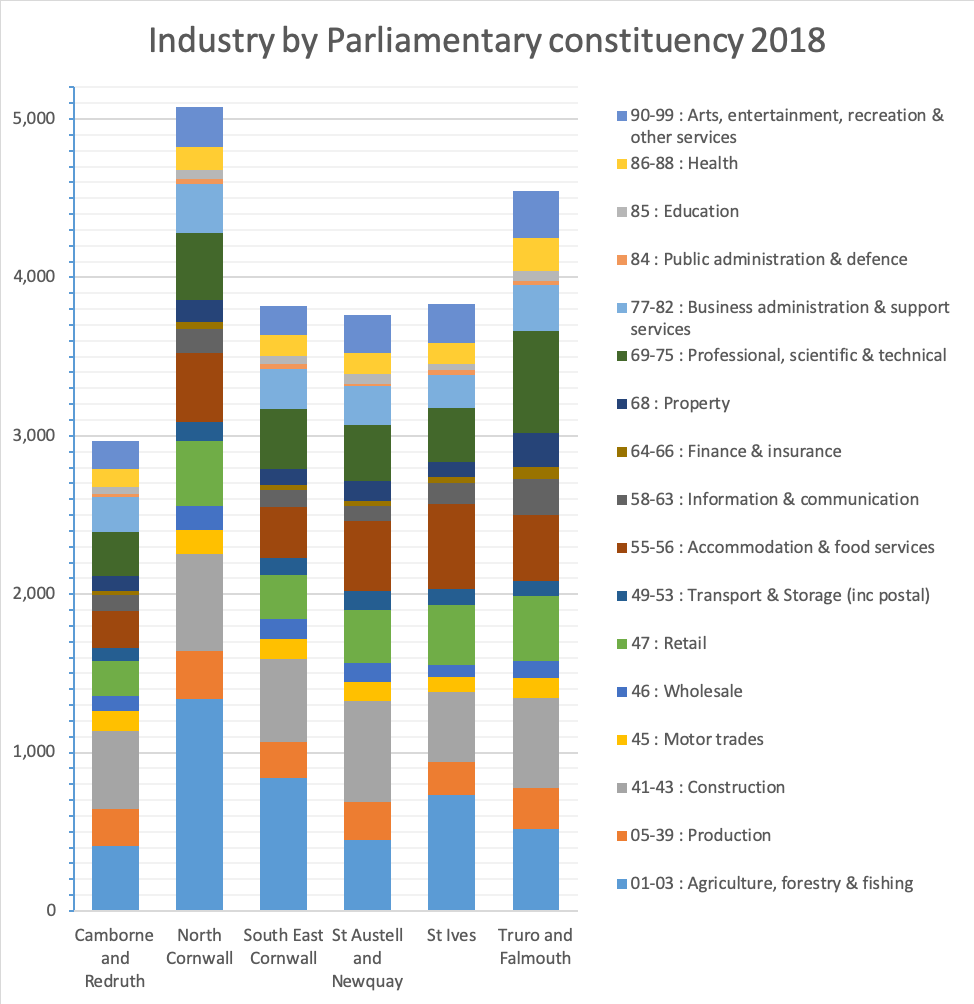
By industry:
- Agriculture, forestry & fishing is still the largest industry overall in Cornwall with 4,280 businesses, a slight increase from 4,255 in 2017 and back to 2016 levels. Construction is the second largest with 3,280 businesses (up from 3,190 in 2017) and third is the Professional, scientific & technical industry with 2,415 businesses (similar to 2,405 in 2017).
- North Cornwall is in the lead when it comes to agricultural businesses with 26.3% of its total 5,075 businesses operating in the industries of agriculture, forestry & fishing; and 31.2% of all Cornwall’s agriculture businesses are in North Cornwall. South East Cornwall comes second with 22.0% of businesses operating in the agricultural industry. Truro & Falmouth has the least with just 11.3%.
- St Austell & Newquay has the greatest proportion of construction sector businesses, with 16.9% of its 3,765 businesses operating in the industry, closely followed by Camborne & Redruth with 16.5%.
- Truro & Falmouth has the greatest proportion of professional, scientific & technical businesses which, with 14.1%, is also the biggest industry overall for the area followed by construction (12.5%).
In terms of business size, about three quarters (74.2%) of businesses in Cornwall have less than 5 employees. Businesses with 5-9 employees represent the second largest group with 14% across Cornwall. North Cornwall has the highest proportion of businesses (21.1%) within the lowest turnover band of less than £50,000.
Camborne and Redruth, as the area with the least number of businesses, has the highest proportion of businesses employing over 10 people (13.7%). It is also the area with the highest proportion of businesses with 8.3% of businesses turning over £1m or more. In terms of absolute numbers however, Truro & Falmouth has the greatest number of businesses (570) with 10 or more employees, followed by North Cornwall (530). Similarly, Truro & Falmouth has the greatest absolute number of businesses turning over £1m or more (335) followed by North Cornwall (310).
More from Cornwall business
CORNWALL BUSINESS ACTIVITY, SIZE AND LOCATION 2020
The 2019 overview of Cornwall business activity, size and location with some comparisons to South West and UK data.
THE DIGITAL, ALWAYS-ON LEARNING OPPORTUNITY
In an effort to increase the average weekly earnings in Cornwall, is Cornwall Council's best approach to invest in online learning?